
Institut Curie Collection
- Access to: InfoSigMap: map of functional redundancies between informative gene sets
Gene Set Enrichment Analysis (GSEA) or other methods (e.g., Representation and Quantification of Module Activity from Target Expression Data, (ROMA)), are generally employed to explore which molecular mechanisms are dysregulated in a two-conditions or multi-conditions transcriptomics dataset. While the use of these tools has nowadays become a routine task in cancer research, extracting biological insights from their output remains a major challenge. Indeed the output of such methods consists of a table reporting for each gene set its enrichment statistics. This organization of the output, containing redundant and interdependent signatures scattered throughout the table, does not help the interpretation of the results and the formulation of consistent biological hypothesis. Some form of organization is thus required to navigate results and this is the task that InfoSigMap achieves.
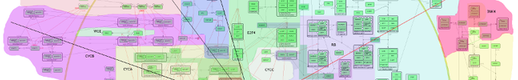
InfoSigMap is thus a user-friendly Google Maps-based tool for functional enrichment visualization. The compendium of 962 informative signatures, selected as the most reliable from a huge collection of widely employed signatures, are here represented as nodes of a network. A different shape is used to denote the gene sets that are only informative (diamond) and those that are also conserved (circle), while the node size denotes the number of genes in the signature. Links in this network represent redundancy relationships between signatures. The major novelty of InfoSigMap is that it takes into account two kind of redundancy: overlap-based and functional redundancy. Indeed as proved in our work, functional redundancy is a frequent phenomenon poorly captured by signatures overlap. Therefore dark gray is used for those edges that connect signatures being both functionally redundant and having a significant Jaccard-Index (JI), a measure of gene content intersection, while light gray denotes links only associated to functional redundancy. Finally, the thickness of the links is proportional to their weights and the standard Cytoscape organic layout is used to spatially organize the network. Nodes are thus arranged such that similar signatures are placed close together. The areas of the network containing signatures associated to same biological functions are identified and manually annotated on the top of the map to help the navigation of the users.
To use InfoSigMap, enrichment results have to be generated outside employing our collection of informative signatures and any available method (e.g. GSEA, ROMA). The signatures ranking output of the analysis can be then charged into InfoSigMap to help a quick navigation of the common activation/repression behaviours of related informative signatures.
Download gmt files containing description of informative signatures and conserved eigengenes.